Case Study
Redesigning discovery
How fixing filters drove a 75% lift in conversion
UniHomes is a student property platform operating at scale across UK university cities. By early 2025, the business had grown significantly, available property stock was up 27% year-on-year, and site traffic had grown 39%. On paper, it looked like a healthy business. The data told a different story.
Despite more properties and more visitors, user-to-lead conversion had dropped 26% year-on-year. More people were arriving, looking around, and leaving without enquiring. The platform was growing in every direction except the one that mattered.
Senior Product Designer
Q3 2025
Product Design

Problem statement
The brief that landed on my desk framed it clearly:
"Despite a 27% year-to-date increase in available property stock and a 39% year-to-date increase in on-site users, UniHomes is experiencing a 26% year-on-year decline in user-to-lead conversion."
The hypothesis was straightforward: users couldn't find what they needed. But the brief didn't tell us why. That was my starting point.


The Stock Problem
More properties should mean more relevant results for more users. Instead, the volume of listings had created a discovery problem. The catalogue had outgrown the tool users had to navigate it.
The filters weren't just unhelpful, they were broken.
My early research sessions quickly became a competition to surface the most egregious recording from Hotjar. Scroll traps, unresponsive toggles, dropdowns that reset on close. The filter UI had accumulated years of incremental additions with no coherent design oversight, and it showed.
The mobile blindspot.
Analytics confirmed what the heatmaps suggested: the majority of UniHomes' users were on mobile. But the filter system had been designed desktop-first, with mobile treated as a secondary consideration. Touch targets were too small, modals were difficult to dismiss, and the filter hierarchy was nearly impossible to navigate on a small screen without accidentally triggering the wrong interaction.
The platform was failing its primary audience by design.


Design Rationalle
Before I opened Figma, I needed to understand the scope of the problem. I audited the existing filter system end-to-end: cataloguing every filter type, interaction pattern, and edge case across desktop and mobile. The audit surfaced three distinct categories of failure:
Structural
Filters that didn't persist, apply correctly, or reflect accurate counts. Users had no confidence that the results matched their selections.
Navigational
Confusing button placement at the top of filter modals, no clear way to close or reset, inconsistent behaviour between filter types.
Hierarchy
All filters treated as equally important, burying the ones users needed most (price, location, room count) alongside rarely-used options with no distinction between them.
Rather than redesigning from scratch, I focused on three principles:
-
Reduce cognitive load
-
Fix the mobile experience
-
Give users immediate feedback on their selections.
A full rebuild would take months. These changes could ship in weeks, and be tested against the live variant.
Crafting solutions
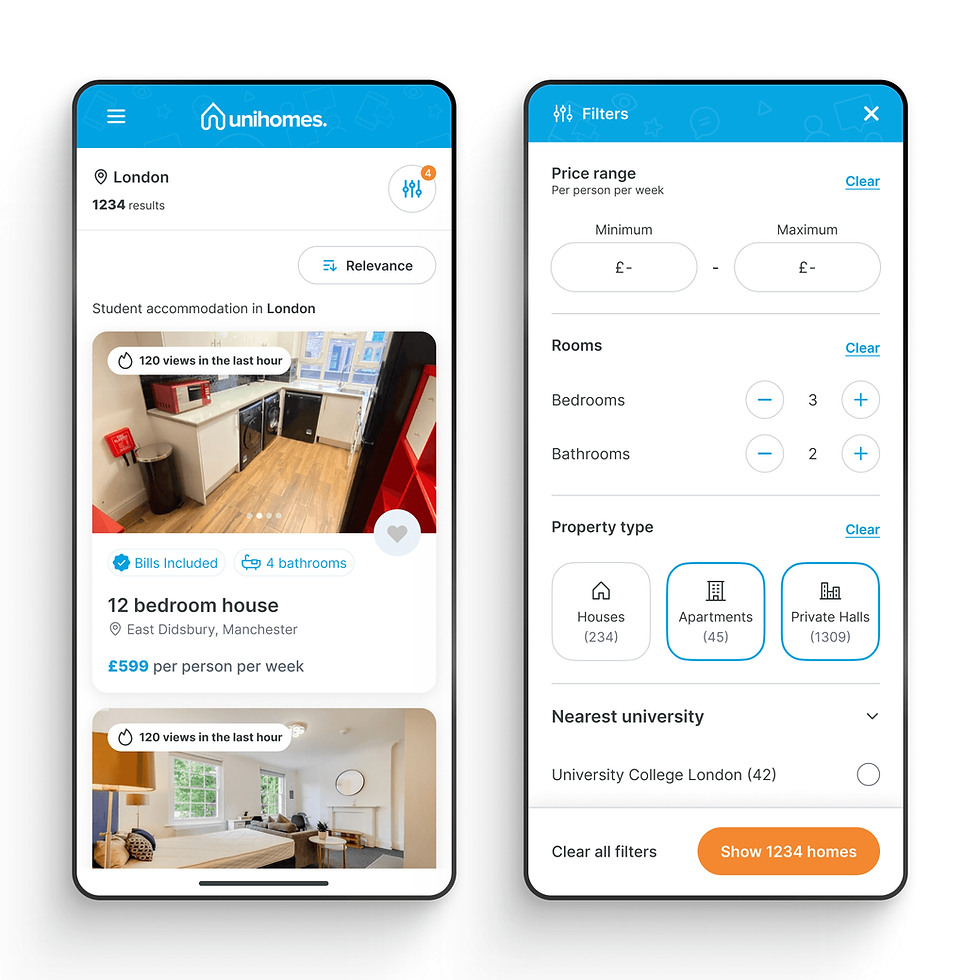
Cutting noise on the page
The search results page was carrying too much visual information competing for attention. I stripped back non-essential UI elements from the listing cards and page chrome, prioritising the data students actually use to make decisions: price, distance from university, room availability, and photo.
Users could now scan results faster, which meant reaching the filter system with a clearer sense of what they were looking for.

Mobile navigation and touch points
The filter modal had an ambiguous button cluster at the top that users consistently tapped by mistake on mobile, triggering a reset or close when they meant to scroll.
I removed these entirely, replacing them with a single persistent CTA at the bottom of the modal: "Show [X] properties." This is a familiar pattern from market-leading accommodation platforms, and it served a dual purpose, it removed the accidental-close problem and gave users a live count of matching results as they filtered.

Consistent filter interactions
The existing system used a mix of toggles, checkboxes, dropdowns, and sliders with no consistent logic for which interaction type was used where. I standardised the interaction model while retaining the underlying filter hierarchy, so users weren't learning a new pattern for every filter category they touched.

Nesting secondary filters
Not all filters are equal. Price, location, and room count drive the majority of filtering behaviour. Bill inclusion, furnishing preferences, and accessibility options are important but secondary. I nested lower-priority filters behind an expandable "More filters" control, reducing the default filter view to the decisions that matter most while keeping everything accessible. This reduced the perceived complexity of the UI without removing any functionality.


Results
The redesigned filter system went into an A/B test against the existing variant. I worked with the data team to define success criteria upfront: we were measuring filter engagement rate, search-to-listing conversion, and ultimately search-to-enquiry conversion.
The test was planned to run for four weeks. It lasted five days.
The new variant's performance was clear enough that Senior Management requested an immediate full rollout. Continuing to run the test meant knowingly serving a worse experience to half our users. We shipped.
+83%
Filter Engagement Rate
+75%
Search-to-listing conversion
Meaningful improvement
Search-to-enquiry (lead generation)
5 days
Test start to full rollout
The +83% filter engagement figure was the one that stuck with me. It meant users weren't avoiding the filters anymore, they were using them. The tool had gone from something people worked around to something that actually helped them. The conversion numbers were a consequence of that.
Reflection
What I'd do differently
The brief arrived framed as a conversion problem, and I solved it as one. In retrospect, I'd push earlier for qualitative research alongside the analytics, talking directly to students about how they searched for properties would have accelerated the insight phase. The Hotjar recordings were compelling but passive; interviews would have been faster.
What this project taught me
Scale exposes design debt faster than anything else. UniHomes hadn't built a bad filter system, they'd built an adequate one that couldn't absorb growth. The lesson is that interaction patterns which work at one volume often quietly fail at another, and analytics alone won't catch it until conversion is already suffering.
